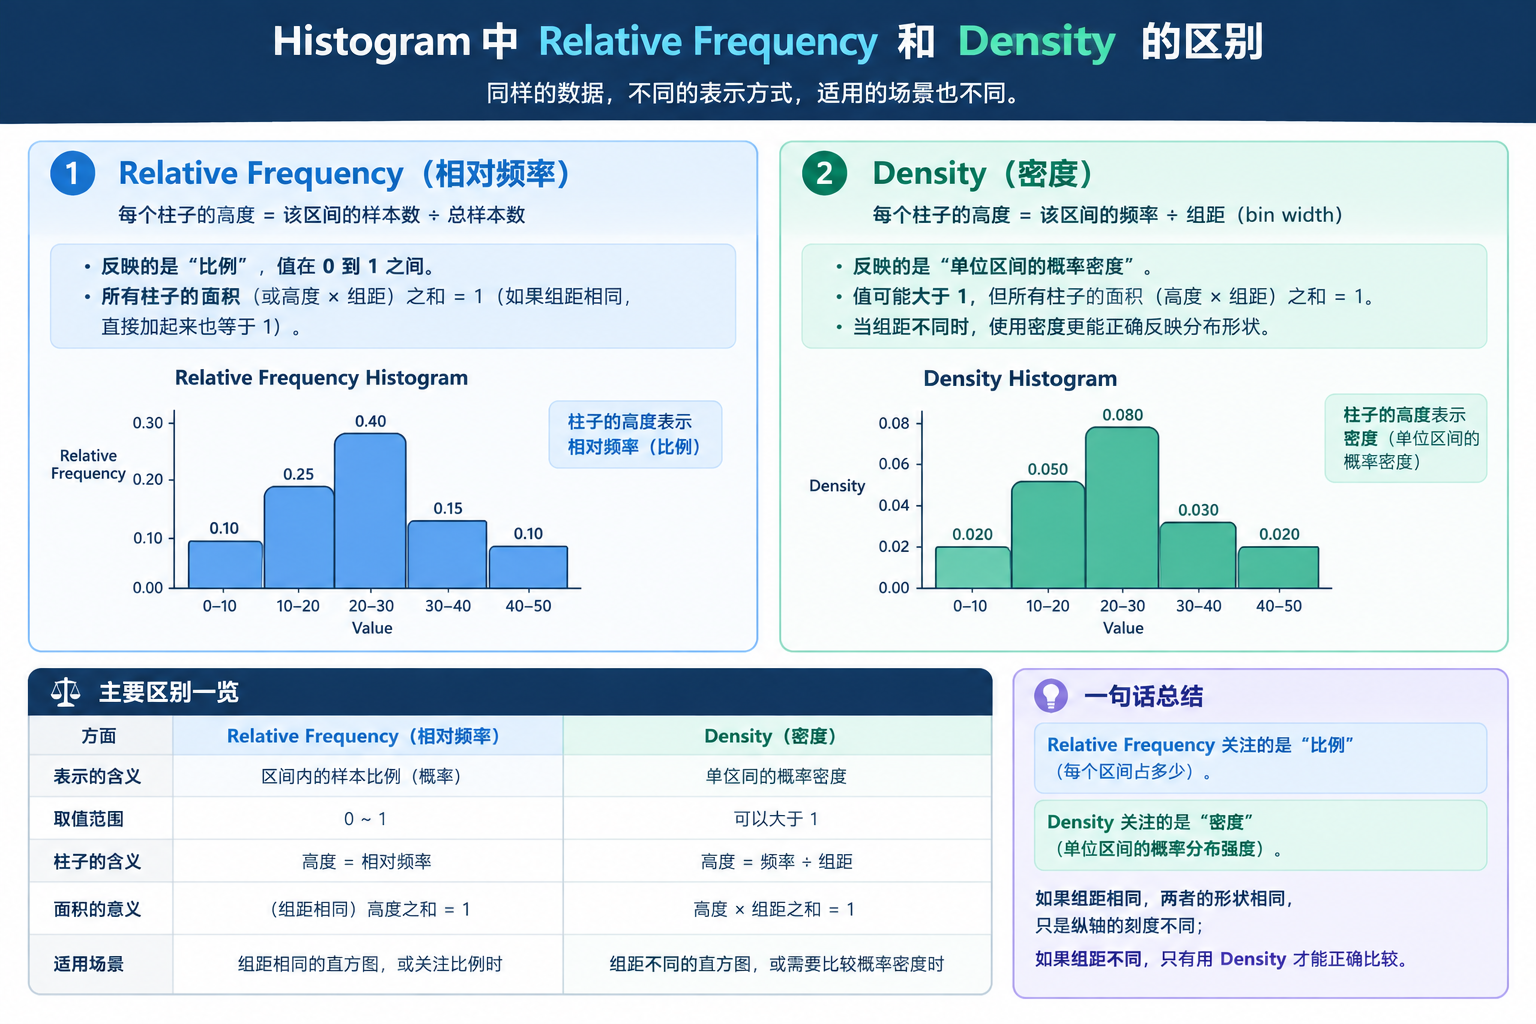
Histogram is used to visualize continuous observations by grouping data into several bins
Height: Relative frequency / density of data points
Relative frequency:
Density:
Let there are bins, the bin width of be , and the number of data observed in the bin is .
Relative frequency =
Density =
Sum of areas of all bins always equal to 1:
Area: Proportional to the num. of observations In PDF, probability is the area under the density curve. Histogram is the discrete version for PDF.
The bin size (num. of bins) is important
Too small: Overfit
Too large: Hide important details & patterns in the data
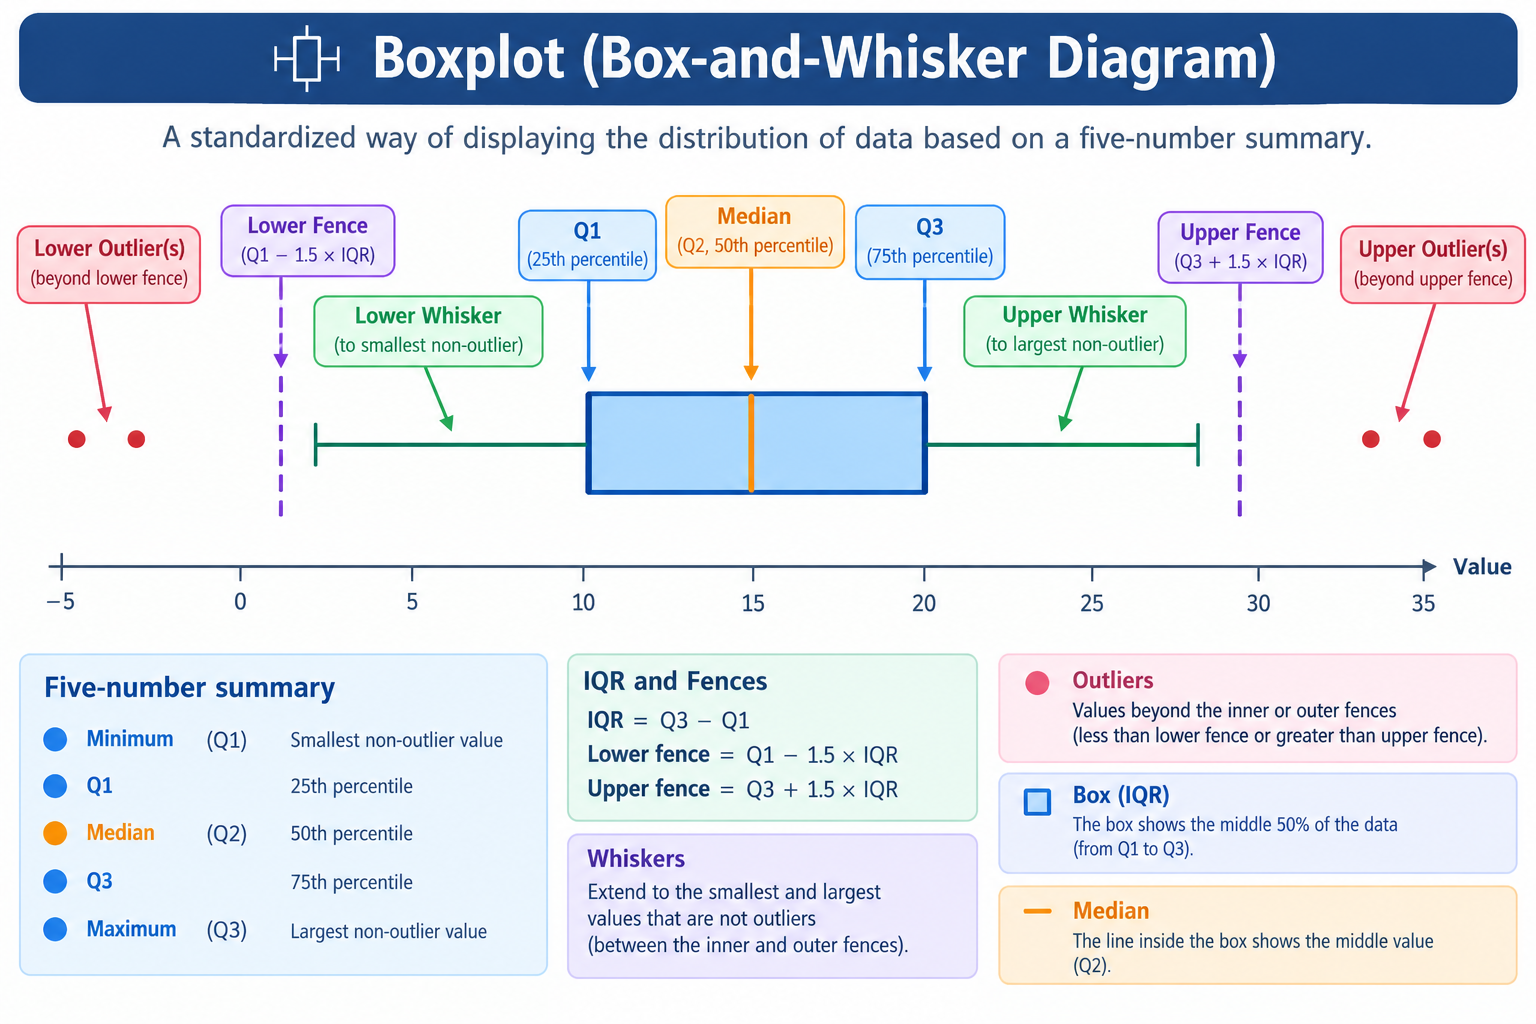
Boxplot
IQR =
Fence
Inner fence: Left /right of box at distance
Outer fence: Left / right of box at distance
Whisker
Lower whisker: From down to the smallest observation
Upper whisker: From up to the largest observation
Suspect outlier: Between inner & outer fence or
Outlier: Beyond the outer fence ( or )
Interpretation
Box shows the middle 50% of data
Whiskers show the range of normal data points
i.e. data within are normal
Left-skewed: Lower whisker is longer than upper whisker
Right-skewed: Upper whisker is longer than lower whisker
Data beyond outer fence are outliers
Boxplot shows the variance & skewness of data + identify outliers
Parameter Estimation / Point Estimation
Given a sample with size from population Assumption:
Sample is representative of the population
Data are i.i.d.
Parameter Space
Suppose sample are random and i.i.d. with unknown parameter and PMF / PDF . The parameter takes value in the parameter space (i.e. domain of )
Note
在之后求解 MLE 时起到硬约束的作用(不可以取超过 的值)
Example For the PDF of normal distribution,
Hence, the corresponding parameter space is
可以取任意 real number 必然是 positive number,必然大于 0
Estimator
写法
名称
性质
例子
大写
随机变量(random variable)
在抽样之前,结果是未知的,是随机的
"下一位被测者的身高"
小写
观测值(observed value)
抽样之后,已经拿到手的确定数值
我实际测到 172.5 cm
Estimator of :
Estimate of : Value of Since outputs a single value, it is called a point estimator
Evaluate estimate
偏差 Bias:
Variance:
Mean square error (MSE):
Consistency:
评估样本多了会不会变好
Maximum Likelihood Estimation
Estimator
使得乘积变成求和,方便求导计算
Maximum likelihood estimator (MLE) : Value of that maximizes
Calculation of MLE
Formulate
这一步的 只是 stationary point,不一定是 maximum point
Example
Bernoulli Distribution
Formulate
Use score function to find MLE
Verify is MLE
Since , is strictly concave function, is the MLE. The MLE is the sample mean in Bernoulli Distribution.
Exponential Distribution
Hence, is the MLE for Exponential Distribution.
Poisson Distribution
Geometric Distribution
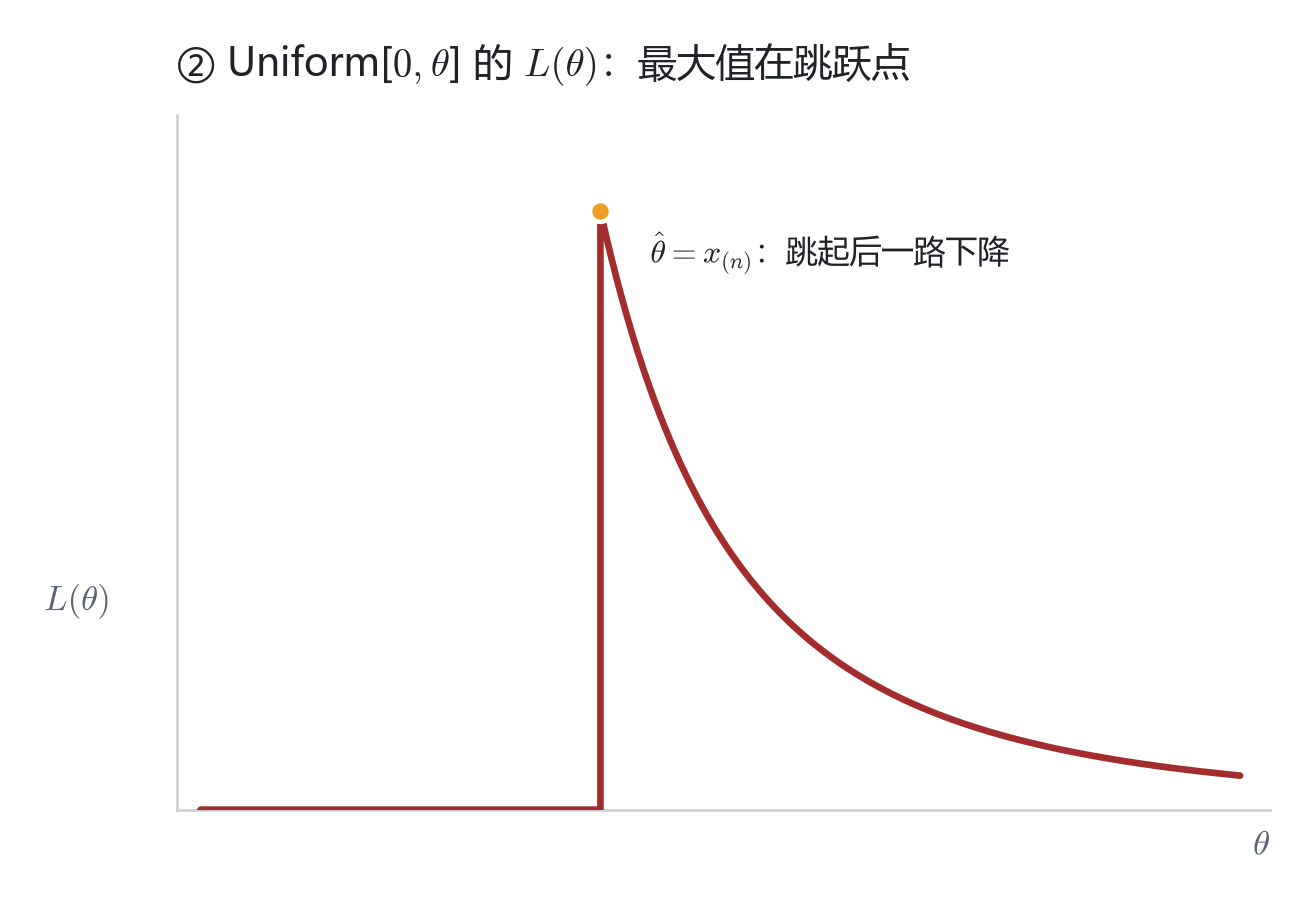
Uniform Distribution (Special Cases)
For the likelihood function ,
If or , then and Hence,
and
However, we cannot use to find because is on the boundary or at a discontinuous point. Hence, we need to introduce indicator function to rewrite . Indicator function is
Rewrite ,
The domain of now becomes . Hence, , which is the min. point within the domain.
Definition
Maximum Likelihood Estimator is MLE of if
It means achieves its max. value at
Unbiased Estimator
Definition
An estimator of is unbiased estimator of if
Otherwise, is biased estimator
Example
Calculate the MLE of normal distribution.
Given that sample variance Rewrite as
Recall that
Hence,
Hence, is unbiased estimator while is biased estimator of
Method of Moments (MoM)
As MLE may not able to find an explicit formula for the max. value, it requires numerical optimization.
For the unknown parameter is -dimensional. For , denote the moment to be
Denote the sample moment to be
Definition
Method of Moments Estimator The method of moments estimator is defined to be the value of s.t.